3_datamen_CMPT_732_project
CMPT 732 Big Data Project Report
Problem Definition:
What is the problem that you are trying to solve? What are the challenges of this problem?
When any business owner decides to open a new store(or expanding an existing business) at new city or a new neighbourhood, It can be challenging for business owners to decide on the best location/products for their stores so that they can make more profits.
Also, when a Vendor salesmen approach business owners asking them to keep/sell their products. A good analysis is needed to check how these products are doing in the market for that city.
Analysis on above questions is necessary to take decisions such as the optimal location for their business, what products they will sell, and how to increase sales when starting a new or expanding an existing business in a new city.
Therefore, by examining the past sales data, our initiative intends to provide analysis on above mentioned questions to inform them with knowledge that can assist them in making profitable decisions.
Now, we plan to test the this strategy on the “Liquor sales” dataset presented by Iowa Govt.
Also, the above strategy can be extended to provide these analysis to stores in other domains. For example, if Safeway plans to open a new store in a new city, we can provide them with answers to above questions and help them maximize their profits.
Methodology:
What is the problem that you are trying to solve? Briefly explain which tool(s)/technique(s) were used for which task and why you chose to implement that way.
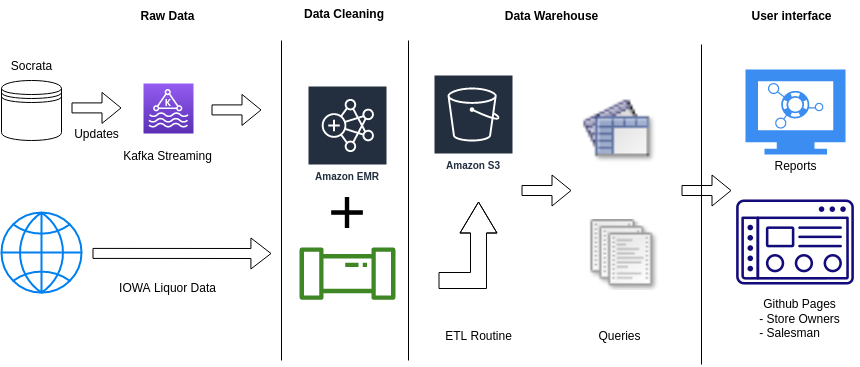
As we mentioned, we used “IOWA Liquor sales data” published by IOWA Government. Now, after obtaining the data, the next task was to clean it, extract-transform-load it into a Data Warehouse and then eventually into a Data Mart, and then generate reports like grouping the most popular drink by region. And the final stage i.e. to visualize the data and make it presentable to the clients.
-
Brief on Data Acquiring and Cleaning
The Iowa Alcoholic Beverages Division receives reports on wholesale transactions, and they make the data (from 2012 to the present) accessible at: https://data.iowa.gov/.
The iowa-liquor dataset is a 5.7 GB file. Through analysis, we found that this table contains store information, product information and transaction information. Among them, there are a lot of redundant and wrong stores data, such as incomplete names, multiple names for the same store, etc. In addition, the geographical location is stored as coordinate point data instead of latitude and longitude, and there are errors in the date format.
In order to facilitate analysis and remove redundant and erroneous data, we used the official store table and product table to replace the original data(by dropping the columns from original Table). In this way, while proofreading the data, it also normalized the data. After solving all the mentioned problems, the data normalizes into three tables namely sale, store and product. Each table can be updated individually via Kafka in real-time. It is convenient for subsequent analysis and mining.
-
Overview of Historical Sales Data and Its Trend
Before we dive into any deeper analysis, we would like to have an overview of the historical sales data, and see whether there is a particular pattern of how the total sale changes.
By using Spark we aggregated the sales data by year and month, and we found there obviously is a pattern: the amount of sale changes in similar way within each year, and the overall trend is steadily increasing.
-
Some Questions We Intend to Answer
(a) Market can be segmented in different ways, for example: by cities, mid-to-high-end liquors, liquor categories, and so on; sales growth rate of market segments under each of these scenarios may have different distributions. We would like to explore which of the scenarios can divide the market most effectively, that is, to reveal the variantion of different market segments, so that vendors can know what to take into consideration when they want to expand their business
(b) Display growth rate distributions under the Top 5 segmentation scenarios
(a) Use the RFM method to model merchants and generate features based on the results.
(b) Use the kmeans method to classify merchants and use geographic coordinates to observe whether the classification results are geographically meaningful
Assuming that the capital at hand is certain, how can we try to maximize the profit?
So, if the business owners have limited capital and limited inventory space which products would be the best ones to invest in or buy and keep in inventory. I.e to find the products that give maximum profits, at the same time, keeping in mind that the inventory space is limited. Therefore, optimizing both the constraints.
Proposed Solution Design:
Problems:
What problems did you encounter while attacking the problem? How did you solve them?
-
Analysing the Big Table
One of the fist issues we faced was loading and analysing the main table present in the database. As it contained only one table that too with 23 columns, it was a little difficult to fully understand the data before we perform any sort of analysis on it. Therefore, we normalized the data into 3 tables sales, store and product which can be consumed individually real-time, and is convenient for subsequent analysis and mining.
-
Dealing with New Data
In this project we are analysing the old historical data to analyse the past trends regarding the sales of the product. But what about the new data which keeps getting generated everyday. Let’s say we run this analysis after a week we might want to consider the last week’s data as well in that analysis and for that we cannot clear and reload the whole database. Therefore, we added a script for Kafka streaming which would keep checking the data-set website every night and if it finds a new range of data it streams the data using Kafka and updates/appends our database with new rows, which can be used in next analysis.
Results:
What are the outcomes of the project? What did you learn from the data analysis? What did you learn from the implementation?
-
Problem 1: What Are the Most Effective Market Segmentation Scenarios?
Using a single feature as the segmentation scenario usually won’t incur a large variation among different segments. The segmentation scenario that causes the largest variance is “city + category + grade”, while other several scenarios followed closely behind also performe well. Vendors should take the top several scenarios into consideration and get a look in depth into different segments under them.
-
Problem 2: Describe and Classify the Current Stores with Respect to Using RFM Model
Through analysis, we found that traditional retail analysis methods can be used to analyze merchants. At the same time, we found that the features obtained by using RFM can classify merchants very well. These classifications directly reflect the simple and direct business logic on the map. Good businesses are located in densely populated areas with convenient transportation and are relatively concentrated. Using this conclusion, we can help merchants make better site selection, and at the same time, for winery sales staff, they can also help them better locate the top customer groups.
-
Problem 3: Optimizing Profit
For the period (30/07/2022 - 30/10/2022), We found that Products like “HA last drop Scotch” and “Remy Martin Louis” can give profit upto USD 1000 per bottle. selling just 100s of these bottles can give profit of atleast USD 100,000 in just 3 months.
Also, it looks like irrespective of the price, “Remy Martin Louis” appears in top 5 products for all 3 quarters which means it has been all time favourite as the same time it has maximum profit margin for business owners. Therefore, it looks like the best product to invest in.
Project Summary:
A summary of what you did to guide our marking.
- Getting the data: Acquiring/gathering/downloading.(1)
- ETL: Extract-Transform-Load work and cleaning the data set. (3)
- Problem: Work on defining problem itself and motivation for the analysis.(3)
- We have already answered it in “Problem Definition” and “Some Questions We Intend to Answer” sections.
- Algorithmic work: Work on the algorithms needed to work with the data, including integrating data mining and machine learning techniques.(4)
- Bigness/parallelization: Efficiency of the analysis on a cluster, and scalability to larger data sets.(1)
- UI: User interface to the results, possibly including web or data exploration frontends. (2)
- We used the Github Pages and Github CI/CD pipleine to create this website to host our report and User interface to result of our analysis and Visualizations.
- Visualization: Visualization of analysis results. (3)
- We used Matplotlib python package and Orange Data Mining to plot a lot of charts to demonstrate the result of our analysis, such as scatter plot, bar charts and line charts.Instances of these can be found in the report and “README.md” of each problem.
- Technologies: New technologies learned as part of doing the project. (3)
- A few technologies we learned and used while completing this project are Orange Data Mining, Amazon S3, Python Spark, Amazon AWS EC2, Socrata, Matplotlib, Github Pages, Kafka streaming, Parquet file format.
Total: 20
Project Contributors: Song Lin (sla475, 301550328), Shlok Nangia (sna101, 301550257), Jialiang Guo (jga169, 301558771)